- 您现在的位置:买卖IC网 > Sheet目录39246 > LM2636M/NOPB (NATIONAL SEMICONDUCTOR CORP) SWITCHING CONTROLLER, 2000 kHz SWITCHING FREQ-MAX, PDSO20
Applications Information (Continued)
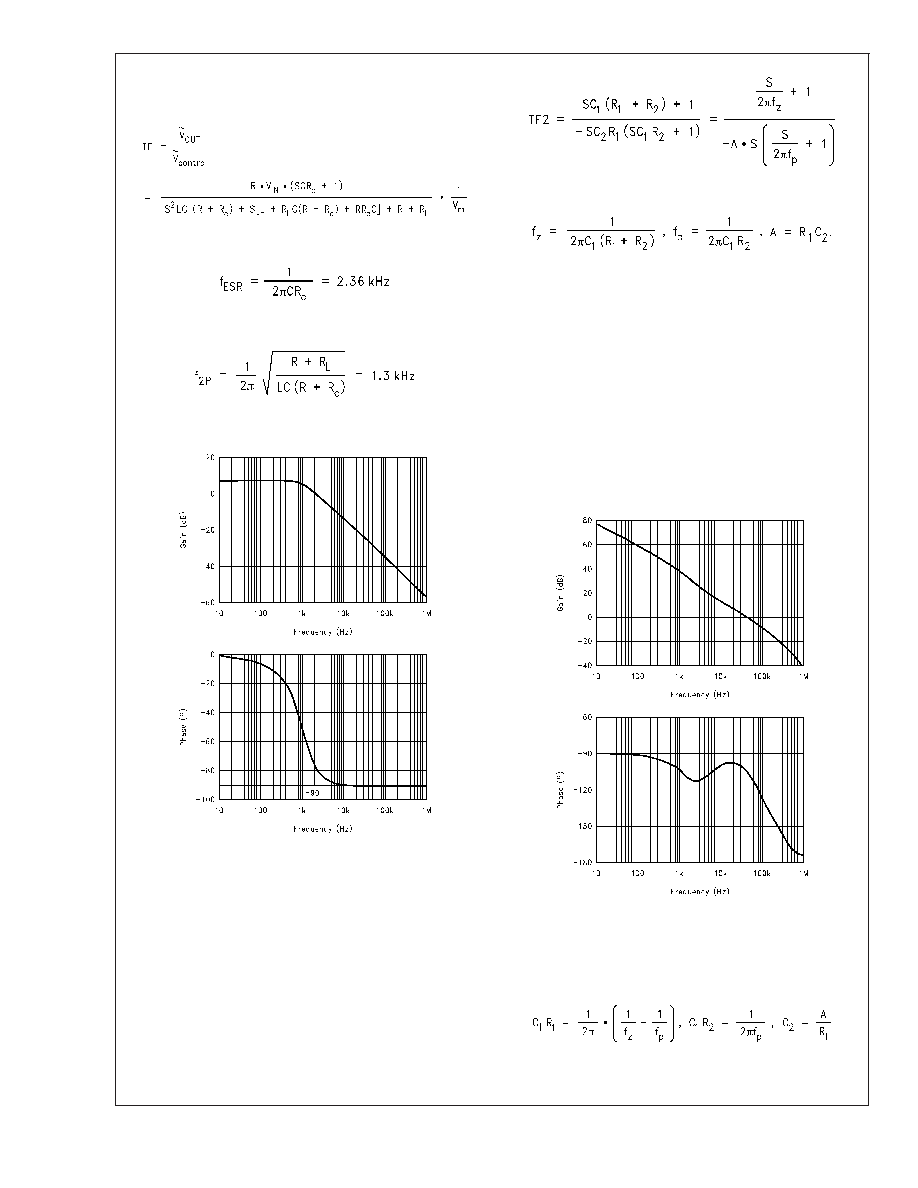
The control-to-output transfer function is
The ESR zero frequency is:
The power stage double pole frequency is:
The corresponding Bode plots are shown in Figure 5.
Since the ESR zero frequency is so low, it effectively cancels
the phase shift from one of the power stage poles. This limits
the total phase shift to 90%.
Although this regulator design is stable (phase shift is <90
when gain = 0dB), it needs compensation to improve the DC
gain and cut off frequency (0dB frequency). Otherwise, the
low DC gain may cause a poor line regulation, and the low
cutoff frequency will hurt transient response performance.
The transfer function for the 2-pole-1-zero compensation
network shown in Figure 4 is:
where
One of the poles is located at origin to help achieve the
highest DC gain. So there are three parameters to deter-
mine, the position of the zero, the position of the second
pole, and the constant A. To determine the cutoff frequency
and phase margin, the loop bode plots need to be gener-
ated. The loop transfer function is:
TF = TF1 x TF2
By choosing the zero close to the double pole position and
the second pole to half of the switching frequency, the closed
loop transfer function turns out to be very good.
That is, if f
Z = 1.32 kHz, fP = 153 kHz, and A = 4.8 x 10
6
F,
then the cutoff frequency will be 50 kHz, the phase margin
will be 72, and the DC gain will be that of the error amplifier.
See Figure 6 below.
The compensation network component values can be deter-
mined by the following equations:
Notice there are three equations but four variables. So one
of the variables can be chosen arbitrarily. Since the current
10083413
FIGURE 5. Control-to-Output Bode Plots
10083417
FIGURE 6. Loop Bode Plots
LM2636
www.national.com
10
发布紧急采购,3分钟左右您将得到回复。
相关PDF资料
LM2661MDC
SWITCHED CAPACITOR CONVERTER, 80 kHz SWITCHING FREQ-MAX, UUC
LM2675-5.0MDC
2.2 A SWITCHING REGULATOR, 275 kHz SWITCHING FREQ-MAX, UUC
LM2675-5.0MWC
2.2 A SWITCHING REGULATOR, 275 kHz SWITCHING FREQ-MAX, UUC
LM2675-12MWC
2.2 A SWITCHING REGULATOR, 275 kHz SWITCHING FREQ-MAX, UUC
LM2682MX/NOPB
SWITCHED CAPACITOR CONVERTER, 15 kHz SWITCHING FREQ-MAX, PDSO8
LM2682M/NOPB
SWITCHED CAPACITOR CONVERTER, 15 kHz SWITCHING FREQ-MAX, PDSO8
LM2685MTCX/NOPB
SWITCHED CAPACITOR REGULATOR, 180 kHz SWITCHING FREQ-MAX, PDSO14
LM2686MTCX/NOPB
SWITCHED CAPACITOR REGULATOR, 180 kHz SWITCHING FREQ-MAX, PDSO14
相关代理商/技术参数
LM2636MTC
制造商:OC White Company 功能描述:DC DC Cntrlr Single-OUT Sync Buck 4.5V to 5.5V Input 20-Pin TSSOP Rail
LM2636MTC/NOPB
功能描述:IC REG SYNCH BUCK 5-BIT 20-TSSOP RoHS:是 类别:集成电路 (IC) >> PMIC - 电源管理 - 专用 系列:- 应用说明:Ultrasound Imaging Systems Application Note 产品培训模块:Lead (SnPb) Finish for COTS
Obsolescence Mitigation Program 标准包装:37 系列:- 应用:医疗用超声波成像,声纳 电流 - 电源:- 电源电压:2.37 V ~ 6 V 工作温度:0°C ~ 70°C 安装类型:表面贴装 封装/外壳:56-WFQFN 裸露焊盘 供应商设备封装:56-TQFN-EP(8x8) 包装:管件
LM2636MTCX
制造商:未知厂家 制造商全称:未知厂家 功能描述:Voltage-Mode SMPS Controller
LM2636MTCX/NOPB
功能描述:IC CTRLR PROG REG 5BIT 20TSSOP RoHS:是 类别:集成电路 (IC) >> PMIC - 电源管理 - 专用 系列:- 应用说明:Ultrasound Imaging Systems Application Note 产品培训模块:Lead (SnPb) Finish for COTS
Obsolescence Mitigation Program 标准包装:37 系列:- 应用:医疗用超声波成像,声纳 电流 - 电源:- 电源电压:2.37 V ~ 6 V 工作温度:0°C ~ 70°C 安装类型:表面贴装 封装/外壳:56-WFQFN 裸露焊盘 供应商设备封装:56-TQFN-EP(8x8) 包装:管件
LM2636MX
制造商:Texas Instruments 功能描述:
LM2636MX/NOPB
功能描述:IC CTRLR PROG REG 5BIT 20-SOIC RoHS:是 类别:集成电路 (IC) >> PMIC - 电源管理 - 专用 系列:- 应用说明:Ultrasound Imaging Systems Application Note 产品培训模块:Lead (SnPb) Finish for COTS
Obsolescence Mitigation Program 标准包装:37 系列:- 应用:医疗用超声波成像,声纳 电流 - 电源:- 电源电压:2.37 V ~ 6 V 工作温度:0°C ~ 70°C 安装类型:表面贴装 封装/外壳:56-WFQFN 裸露焊盘 供应商设备封装:56-TQFN-EP(8x8) 包装:管件
LM2637
制造商:未知厂家 制造商全称:未知厂家 功能描述:
LM2637A E WAF
制造商:Texas Instruments 功能描述: